Contents
- Lesson 4: Measuring psychometric functions
- The method of constant stimuli
- We'll first define the list of coherence values and the number of
- Next we'll generate the order for stimulus presentation. An easy way to
- Plotting the psychometric function
- Plotting on a log axis
- The 3-Down 1-Up staircase method
- Plotting the staircase
- Exercises
Lesson 4: Measuring psychometric functions
In this lesson we'll use the 2AFC paradigm for motion coherence to measure a subject's 'psychometric function' - performance as a function of stimulus strength. We'l cover two ways of choosing the stimulus strength for each trial - the method of 'constant stimuli' and a '3-down 1-up staircase method'.
This is the next step toward our ultimate goal of obtaining a subject's coherence 'threshold', which is the coherence level that is expected to produce a certain level of performance, say 80% correct. Estimating the threshold involves fitting a curve to the psychometric function and will be covered in Lesson 5.
The method of constant stimuli
This is the simplest method. We choose a set of stimulus strengths (coherence values in our case) and a number of trials that each strength will be presented. We then present the trials in a random order.
As always, we need to define the display structure
clear all

display.dist = 50;  %cm
display.width = 30; %cm
display.skipChecks = 1; %avoid Screen's timing checks and verbosity
We'll first define the list of coherence values and the number of
repeats. I like to put all parameters associated with the experimental design in a single structure. We'll call this structure 'design'.
design.coherenceList = [.025,.05,.1,.2,.4];
design.nReps = 10;
design.nTrials = length(design.coherenceList)*design.nReps;
We also need to define some timing parameters
design.stimDur = .5;           %duration of stimulus (sec)
design.responseInterval = .5;  %window in time to record the subject's response
design.ITI = 1.5;             %inter-trial-interval (time between the start of each trial)
And we need to define the parameters for the dots
dots.nDots = 200;
dots.speed = 5;
dots.lifetime = 12;
dots.apertureSize = [12,12];
dots.center = [0,0];
dots.color = [255,255,255];
dots.size = 8;
dots.coherence = NaN;         %to be defined on each trial
Next we'll generate the order for stimulus presentation. An easy way to
make this random list is to use 'repmat' and shuffle:
temp = repmat(design.coherenceList,design.nReps,1);
Then we'll unwrap this list and shuffle
design.coherences = shuffle(temp(:));
And we'll design a list of directions randomly chosen for each trial
temp = ceil(rand(1,design.nTrials)+.5);  %50/50 chance of a 1 (up) or a 2 (down)
design.directions = (temp-1)*180; %1 -> 0 degrees, 2 -> 180 degrees

%set up a 'results' structure
results.intensity = design.coherences;
results.response = NaN*ones(1,design.nTrials);  %to  be filled in after each trial

%Let's open the screen and get going!
try
    display = OpenWindow(display);

    drawText(display,[0,6],'Press "u" for up and "d" for down',[255,255,255]);
    drawText(display,[0,5],'Press Any Key to Begin.',[255,255,255]);

    display = drawFixation(display);

    while KbCheck; end
    KbWait;

    %record the clock time at the beginning
    startTime = GetSecs;
    %loop through the trials
    for trialNum = 1:design.nTrials
        %set the coherence level and the direction for this trial
        dots.coherence = design.coherences(trialNum);
        dots.direction = design.directions(trialNum);

        %Show the stimulus

        %Rush('movingDots(display,dots,design.stimDur);',2);
        movingDots(display,dots,design.stimDur);

        %Get the response within the first second after the stimulus
        keys = waitTill(design.responseInterval);

        %Interpret the response provide feedback
        if isempty(keys)  %No key was pressed, yellow fixation
            correct = NaN;
            display.fixation.color{1} = [255,255,0];
        else
            %Correct response, green fixation
            if (keys{end}(1)=='u' && dots.direction == 0) || (keys{end}(1)=='d' && dots.direction == 180)
                results.response(trialNum) = 1;
                display.fixation.color{1} = [0,255,0];
                %Incorrect response, red fixation
            elseif (keys{end}(1)=='d' && dots.direction == 0) || (keys{end}(1)=='u' && dots.direction == 180)
                results.response(trialNum) = 0;
                display.fixation.color{1} = [255,0,0];
                %Wrong key was pressed, blue fixation
            else
                results.response(trialNum) = NaN;
                display.fixation.color{1} = [0,0,255];
            end
        end

        %Flash the fixation with color
        drawFixation(display);
        waitTill(.15);
        display.fixation.color{1} = [255,255,255];
        drawFixation(display);

        %Now wait for the clock to catch up to the time for the next trial
        waitTill(trialNum*design.ITI,startTime);
    end

catch ME
    Screen('CloseAll');
    rethrow(ME)
end
Screen('CloseAll');

% Save the results


save resultsConstant results design
You might have noticed interesting about the way the global timing was handled. The last line of the loop for the trials is a waitTill call using the 'startTime' measure of the clock at the beginning of the trial sequence. This makes sure that the next trial starts at the appropriate time, regardless of any variability in the timing within each trial.
Plotting the psychometric function
We have results! You can take a look at the 'results' structure to see how you did. But we really need to look at a plot of the psychometric function to appreciate the results, which involves calculating the percent correct for every coherence value shown.
We'll eventually write a function that plots a psychometric function based on the 'results' structure. Ideally, we should be able to generate this plot with using 'results' alone (and not the 'design' structure).
That means we need to generate a list of intensity (coherence) values from the results structure. The function 'unique' does this for us.
intensities = unique(results.intensity);

% Then we'll loop through these intensities calculating the proportion of
% times that 'response' is equal to 1:

nCorrect = zeros(1,length(intensities));
nTrials = zeros(1,length(intensities));

for i=1:length(intensities)
    id = (results.intensity == intensities(i))' & ~isnan(results.response);
    nTrials(i) = sum(id);
    nCorrect(i) = sum(results.response(id));
end

pCorrect = nCorrect./nTrials;
Plotting on a log axis
The x-axis values, motion coherence, increase as multiples which means that they're equally spaced on a log axis. So we'll plot the psychometric function on a log-x axis. Matlab has a function for this 'semilogx', but I don't like it because of the way it labels the x-axis. Instead, I like to use the regular 'plot' function but take the log of the x (or y) values and then change the tick labels. To do this, I have two functions 'logx2raw' and 'logy2raw' that change the labels. Here's an example:
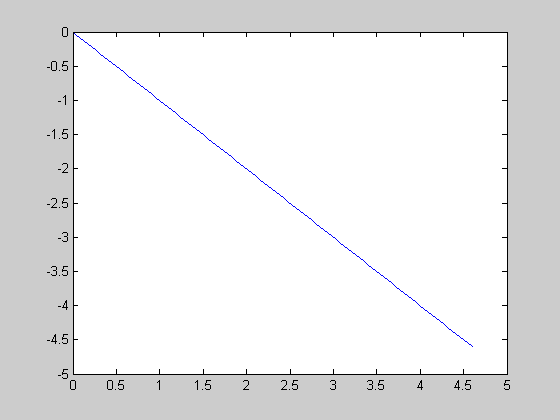
% Choose x values equally spaced on a log axis:

x = exp(linspace(log(1),log(100),101));

% Let y be 1/x

y = 1./x;

figure(1)
clf
plot(log(x),log(y))
Set the x and y tick values to some more sensible numbers:
set(gca,'XTick',log([1,5,10,50,100]));
set(gca,'YTick',log([.01,.05,.1,.5,1]));
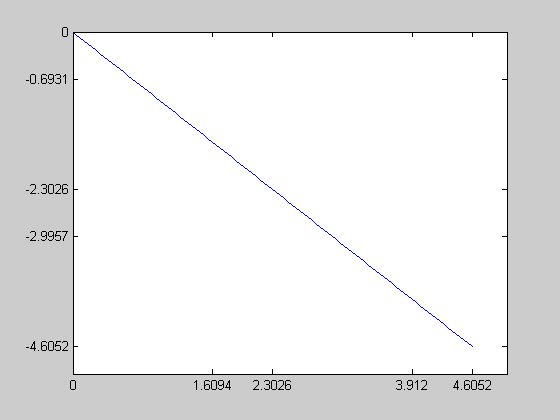
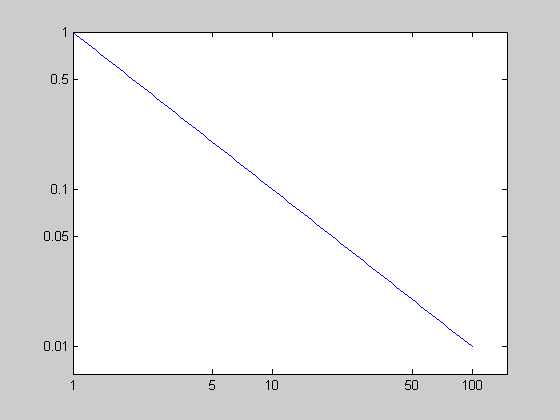
Now we'll change the axes:
logx2raw
logy2raw
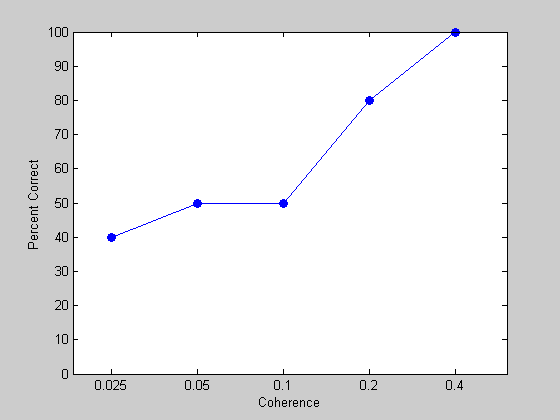
We're ready to plot pCorrect as a function of intensities. Since the coherence values increased by multiples of two, we'll plot the results on a log-x axis so that the values will be equally spaced.
figure(1)
clf
plot(log(intensities),100*pCorrect,'o-','MarkerFaceColor','b');
set(gca,'XTick',log(intensities));
set(gca,'YLim',[0,100]);
xlabel('Coherence');
ylabel('Percent Correct');
logx2raw
The 3-Down 1-Up staircase method
You might have noticed that there were many trials that were really easy. Intuitively, you can guess that these easy trials aren't providing much information about the subject's threshold. It would make more sense to show most of the trials with harder coherence values. In fact, for calculating the threshold, it's best to use coherence values that should yield a percent correct right around the value used to estimate the threshold (e.g. 80%).
An easy and efficient way to do this is with the '3-down 1-up' staircase method. With staircase methods, the intensity shown on each trial depends on the subject's performance on previous trials. For 3-down 1-up, we make it easier (increase the intensity by a multiplicative facor) after an inccorect response, and make it harder (decrease the intensity by the reciprical of the same factor) after three correct responses in a row.
In the limit, the intensity level should gravitate toward a value that has an equal probability of getting easier and getting harder. Thus, the probability of getting 3 in a row correct is equal to 1/2.

or
(1/2)^(1/3)
%
% So a 3-down 1-up staircase method will naturally adjust the intensity
% level to show trials that lead to about 80% correct.  Cool?  I think so.
ans =

    0.7937
Here's some code that implements a 3-down 1-up staircase. You'll see that it's very similar (and not much more complicated) than the method of constant stimuli.
As always, we need to define the display structure
clear all

display.dist = 50;  %cm
display.width = 30; %cm
display.skipChecks = 1; %avoid Screen's timing checks and verbosity

% Insead of a list of coherence values, we'll choose a starting value and a
% step size.  We can choose any number of trials.

design.startingCoherence =  1;
design.stepSize = .5;
design.nTrials = 60;

% We'll use the same timing parameters:
design.stimDur = .5;           %duration of stimulus (sec)
design.responseInterval = .5;  %window in time to record the subject's response
design.ITI = 1.5;             %inter-trial-interval (time between the start of each trial)

% And we need to define the parameters for the dots
dots.nDots = 200;
dots.speed = 5;
dots.lifetime = 12;
dots.apertureSize = [12,12];
dots.center = [0,0];
dots.color = [255,255,255];
dots.size = 8;
dots.coherence = design.startingCoherence;       %coherence  level for the first trial

% Design a list of directions randomly chosen for each trial
temp = ceil(rand(1,design.nTrials)+.5);  %50/50 chance of a 1 (up) or a 2 (down)
design.directions = (temp-1)*180; %1 -> 0 degrees, 2 -> 180 degrees

%set up a 'results' structure
results.intensity = NaN*ones(1,design.nTrials);  %to  be filled in after each trial
results.response = NaN*ones(1,design.nTrials);   %to  be filled in after each trial

%this parameter keeps track of the number of correct responses in a row
correctInaRow = 0;

%Let's open the screen and get going!
try
    display = OpenWindow(display);

    drawText(display,[0,6],'Press "u" for up and "d" for down',[255,255,255]);
    drawText(display,[0,5],'Press Any Key to Begin.',[255,255,255]);

    display = drawFixation(display);

    while KbCheck; end
    KbWait;

    %record the clock time at the beginning
    startTime = GetSecs;
    %loop through the trials
    for trialNum = 1:design.nTrials
        %set the coherence level and the direction for this trial
        dots.direction = design.directions(trialNum);

        %Show the stimulus
        movingDots(display,dots,design.stimDur);

        %Get the response within the first second after the stimulus
        keys = waitTill(design.responseInterval);

        %Interpret the response provide feedback and deal with
        results.intensity(trialNum) = dots.coherence;

        if isempty(keys)  %No key was pressed, yellow fixation
            correct = NaN;
            display.fixation.color{1} = [255,255,0];
        else
            %Correct response, green fixation
            if (keys{end}(1)=='u' && dots.direction == 0) || (keys{end}(1)=='d' && dots.direction == 180)
                results.response(trialNum) = 1;
                correctInaRow = correctInaRow +1;
                 if correctInaRow == 3
                    dots.coherence = dots.coherence*design.stepSize;

                    correctInaRow = 0;
                end
                display.fixation.color{1} = [0,255,0];
                 %Incorrect response, red fixation
            elseif (keys{end}(1)=='d' && dots.direction == 0) || (keys{end}(1)=='u' && dots.direction == 180)
                results.response(trialNum) = 0;
                dots.coherence = dots.coherence/design.stepSize;
                dots.coherence = min(dots.coherence,1);
                correctInaRow = 0;
                display.fixation.color{1} = [255,0,0];
            else %Wrong key was pressed, blue fixation
                results.response(trialNum) = NaN;
                display.fixation.color{1} = [0,0,255];
                %Note, for wrong keypresses, don't update the staircase
                %parameters
            end
        end

        %Flash the fixation with color
        drawFixation(display);
        waitTill(.15);
        display.fixation.color{1} = [255,255,255];
        drawFixation(display);

        %Now wait for the clock to catch up to the time for the next trial
        waitTill(trialNum*design.ITI,startTime);
    end

catch ME
    Screen('CloseAll');
    rethrow(ME)
end
Screen('CloseAll');

% Save the results

save resultsStaircase results design
Plotting the staircase
It's useful to look at how the intensity (coherence) values changed from trial to trail. This can be seen by simply plotting the values in 'results.intensity' with matlab's 'stairs' function. We'll plot the intensity values on a log axis so that they're equally spaced.
figure(1)
clf
stairs(log(results.intensity));

% Let's get fancy and plot green and red symbols where trials had correct
% and incorrect responses respectively:

correctTrials = results.response==1;
hold on
plot(find(correctTrials),log(results.intensity(correctTrials)),'ko','MarkerFaceColor','g');

incorrectTrials = results.response==0;
plot(find(incorrectTrials),log(results.intensity(incorrectTrials)),'ko','MarkerFaceColor','r');
set(gca,'YTick',log(2.^[-4:0]))
logy2raw;

xlabel('Trial Number')
ylabel('Coherence');
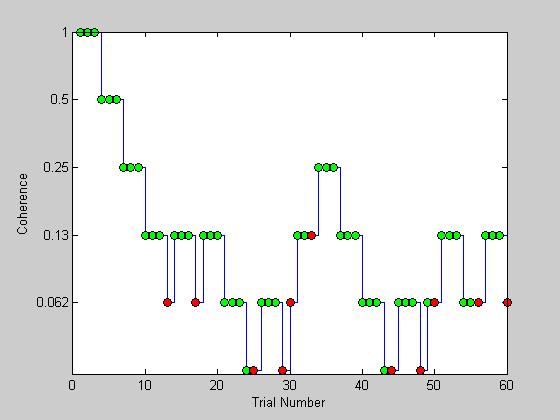
You can see from my example (running myself sitting in my office) that the staircase is hovering around a coherence level between 0.1 and 0.2.
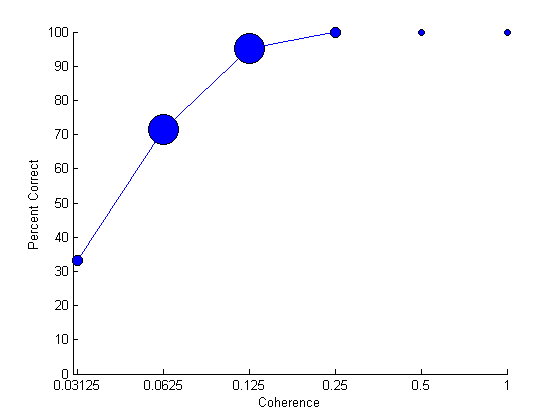
Let's plot the psychometric function from the same data using similar code as before. The one change we'll make is to have the size of each symbol grow with the number of trials presented at the corresponding stimulus intensity. This lets us get a feeling for the 'weight' of each data point. (This wasn't necessary for constant stimuli. Why not?)
intensities = unique(results.intensity);

% Then we'll loop through these intensities calculating the proportion of
% times that 'response' is equal to 1:

nCorrect = zeros(1,length(intensities));
nTrials = zeros(1,length(intensities));

for i=1:length(intensities)
    id = results.intensity == intensities(i) & isreal(results.response);
    nTrials(i) = sum(id);
    nCorrect(i) = sum(results.response(id));
end

pCorrect = nCorrect./nTrials;

figure(2)
clf
hold on
 plot(log(intensities),100*pCorrect,'-','MarkerFaceColor','b');
 %loop through each intensity so each data point can have it's own size.
for i=1:length(intensities);
    sz = nTrials(i)+2;
    plot(log(intensities(i)),100*pCorrect(i),'ko-','MarkerFaceColor','b','MarkerSize',sz);
end

set(gca,'XTick',log(intensities));
logx2raw;
set(gca,'YLim',[0,100]);
xlabel('Coherence');
ylabel('Percent Correct');
This is the simplest possible version of an adaptive staircase method. There are many, many modifications of this, some of which are discussed in the homework section.
Exercises
- Generate your own psychometric function for coherernce by running the 3-down 1-up staircase method on yourself. Plot the staircase and the psychometric function like we did here. Save the results in a file called 'results.mat' (save results results)
- Small step sizes are useful to adequately sample the range of intensities, but if the step sizes are too small, the staircase may never get down (or up) to the threshold. One way to fix this is to have the step sizes start out large in the beginning of the staircase. Write a version of the 3-down 1-up staircase method where the step sizes are 0.2 for the first 10 trials an then drop to 0.1 for the remaining 35.
- What percent correct should a staircase converge to if you did a 2-down 1-up staircase?
- You might have noticed that you can predict how difficult the next trial will be based on your recent performance - e.g. after making a mistake the next trial may be noticably easier. This predictability can be reduced by using a 'double staircase' method where two staircases are run in parallel. Modify the code above with two staircases, each with 30 trials each where intensity for each trial is determined randomly from one of the two staircases. Hint: you'll have to keep track of two different 'correctInaRow' values and coherence values but you can store the results in the same structure as before.
- Modify the code to calculate your 'speed discrimination' psychometric function using a 'two-interval forced-choice procedure'. Each trial will consist of two successive stimuli instead of one. One interval will have dots set to the 'baseline' speed (5 deg/sec). The second will be set to that speed plus an increment. The order will be randomized on each trial and the task for the subject is to determine which interval '1' or '2' has the faster speed. Adjust the increment in a 3-down 1-up staircase. You'll have to choose your own starting increment and step size to see what works best.