Personal website
Current position :
Birthplace:
Alma mater:
Fields of study:
Assistant professor
Heinrich-Heine-University, Düsseldorf (Dipl., Ph.D.)
Biology, Natural Sciences
Methodological expertise
- Combination of whole-cell patch-clamp & caged-glutamate photolysis
In acute brain slice preparations (background) visually identified neurons are electro-physiologically characterized. After that, inactive caged-glutamate is added to the bath solution. A UV flash is focused through the objective onto numerous different cortical fields of 50x50 µm in size. In these fields, very locally, caged glutamate is photolysed to active L-glutamate which activates local neurons. With computer controlled methods a large cortical area (grid) is mapped without gaps for any origins of monosynaptic excitatory and inhibitory inputs. The spatial resolution is sufficient to reveal not only layer-, but also sublayer-specific differences in functional connectivity.

In the last recent years the combination of whole-cell recording and caged-glutamate photolysis revealed new, sometimes even surprising details about the integration of defined neuron-classes in the somatosensory cortex. For several neuron classes we could give evidence for cell-type as well as layer-specific properties that revealed intracortical translaminar and transcolumnar pathways which partially so far have been assumed without direct prove only. These data delivered important details for a better understanding of the modular organization of cortical processsing of sensory information.
Recently the method described before was further improved by adding the technique of simultaneous recording of pairs neurons. Mapping the functional connectivity of two synaptically connected neurons simultaneously hopefully will give new insights about, how cortical microcircuits integrate sensory information.
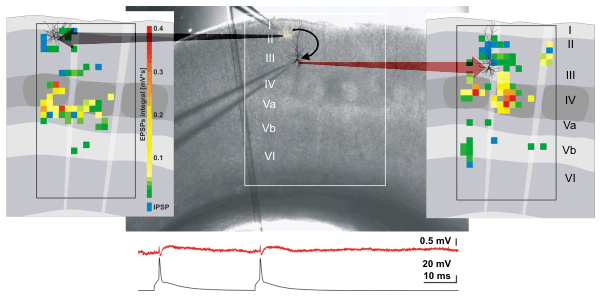
Functional connectivity maps of two synaptically connected pyramidal cells in layers II/III of the rat barrel cortex: Photomicrograph of the native brain slice with positioned recording electrodes (center) and, respectively, drawings of their columnar and laminar organization (left/rightp) are super-imposed by the somatodendritic reconstructions of each of the two simultaneously recorded neurons and the maps of origins for synaptic inputs. The maps illustrate the origins for excitatory (green to red) inhibitory synaptic inputs (blue) onto each of the pyramidal cells.
- Multi-electrode-array (MEA) recording
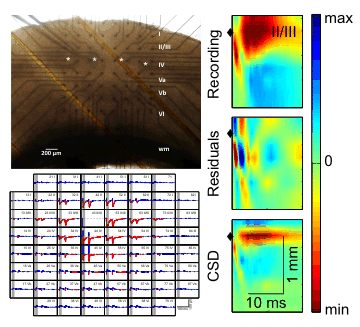
Upper left: Photomicrograph of slice preparation of the barrel cortex mounted on top of a MEA chip with a patch clamp recording electrode positioned in the granular layer IV. White asterisks mark the positions of the barrels in layer IV. wm - white matter.
Lower left: Stimulus responses recorded from the 60 channel MEA chip with electrodes aligned in an 8x8 grid Stimuli were applied at an electrode in layers II/III.
Right column: Responses upon supra-granular stimulation. The stimulated row is indicated by the diamond symbol at time zero. Voltage signal are expressed in colour. The first row contains the original local field potential data, the second row contains the residuals, and the thrid row contains the one-dimensional current source density (CSD) estimates.
since 05.2011 |
Assistant professor in the Dept. of Cogn. Neuroscience, Section Cellular Neurophysiology, Donders Inst. of Brain, Cogn. & Behaviour Radboud University Nijmegen Medical Center |
09.2006 – 05.2011 |
Post-doc / tenure track position in the Dept. of Cogn. Neuroscience, Section Neurophysiology & Neuroinformatics, Radboud University Nijmegen Medical Center |
06.2003 - 09.2003 |
Research fellow at the Institute for Neurophysiology (Workgroup of Dr. G. Tamás); University of Szeged, Hungary; Work on paired, triple and quadruple patch-clamp recordings of excitatory and inhibitory neurons in rat barrel cortex and their synaptic connectivity. |
05.2003 – 09.2006 |
Post-doc position in the C. & O. Vogt Institute for Brain Research; Universitity of Düsseldorf. |
05.2003 |
Graduation as PhD in natural sciences (Dr. rer. nat., grade: "magna cum laude"). |
01.2001 - 12.2001 |
PhD scholarship holder of the „Gertrud Reemtsma Stiftung“. |
04.1998 – 05.2003 |
Experimental studies on the PhD thesis: Investigation of the functional connectivity of excitatory neurons in the somatosensory cortex of the rat (Supervisor: Prof. Dr. H.J. Luhmann, Institute of Neurophysiology in cooperation with the C. & O. Vogt Institute of Brain Research, Prof. Dr. K. Zilles; University of Düsseldorf). |
1998
|
Diploma in biology. Thesis on the effects of caffeine, menthol and nifluminic acid on the membrane properties of P-Neurons in the CNS of the leech Hirudo medicinalis (Institute of Neurobiology, Prof. Dr. W.R. Schlue). |
1996 |
Research work for the International Workshop of Human Leukocyte Differentiation Antigens (Institute of Hemostasis and Transfusion Medicine, Priv. Doz. Dr. M. Schneider; Heinrich-Heine-University Düsseldorf) on antigens in Ewing-sarcoma biopsy material. |
1991 - 1998 |
Studies of Biology at the Heinrich-Heine-University of Düsseldorf, Germany. |
since 2012 |
Lecturer of the bachelor course “Neuroscience” for students of Biomedical Sciences (UMC Nijmegen) |
since 2011 |
Lecturer of the master courses “Quantitative Brain networks” and “advanced Quantitative Brain Networks” for students of Lifesciences (FNWI Nijmegen) |
since 2011 |
Coordinator of the Minor in Neuroscience for students of Biomedical Sciences (UMC Nijmegen) |
since 2010 |
Co-organizer and lecturer of the course “Translationele neuroscience” for students of Human Medicine (UMC Nijmegen) |
since 2009 |
Organizer and lecturer of the theoretical course “Project Cellbiofysika” for students of Molecular Lifesciences (FNWI Nijmegen) |
since 2008 |
Organizer and lecturer of the theoretical course “Neuroscience: from basics to clinics” for students of Biology and Molecular Lifesciences (FNWI Nijmegen) |
2007 - 2011 |
“Capita selecta” lectures for students of Biomedical Sciences (UMC Nijmegen) |
2006 – 2010 |
Practical courses of Biophysics for students of Biomedical Sciences (UMC Nijmegen) |
2004 - 2006 |
Practical courses of Physiology for students of Human Medicine (University Düsseldorf). |
2004 - 2006 |
Physiological seminars for students of Human Medicine (University Düsseldorf). |
1994 – 1998 |
Tutor in Neurobiology for students of Biology (University Düsseldorf). |