Auditory Double Stimuli in Elevation
Percepts evoked by auditory double stimuli in azimuth are well understood (see for example Blauert 1997). If two speakers are arranged symmetrically around the subject’s mid-sagittal plane a phantom source is perceived straight ahead at zero degree azimuth. This can be explained by the underlying physics. To localize a single sound source in azimuth humans use two cues present in the sound source, namely interaural time differences (ITDs) for low frequencies (up to about 1 kHz) and interaural level differences (ILDs) for high frequencies (starting at about 3 kHz). For symmetrical double speaker configurations ITDs and ILDs are both zero, i.e. differences in path length between the two speakers and ears and attenuation by the head are cancelled out (Fig. 1A). The same principle can be used to explain the percept evoked by asymmetrical configurations or situations in which one speaker emits a louder sound.
In elevation, however, monaural spectral cues, so-called head-related transfer functions (HRTFs; Fig. 1B), are used for localization. Psychophysically it has been demonstrated that subjects perceive one sound when simultaneously presented with identical sounds in the mid-sagittal plain (Best, Van Schaik & Carlile 2004). So far, however, no explanation has been proposed as to how this phantom percept at about zero deg elevation emerges (Fig. 1B). It could be possible that the sum of the top and bottom HRTFs resemble the HRTF of zero degree elevation. This mechanism would be comparable to the one found in azimuth: Averaging occurs at the periphery. Note, however, that HRTFs are considered to be a linear time invariant (LTI) system which means that the HRTF of the top and bottom speakers would be conserved in the summed HRTF.
Rationale
last modified Jan 01 2009
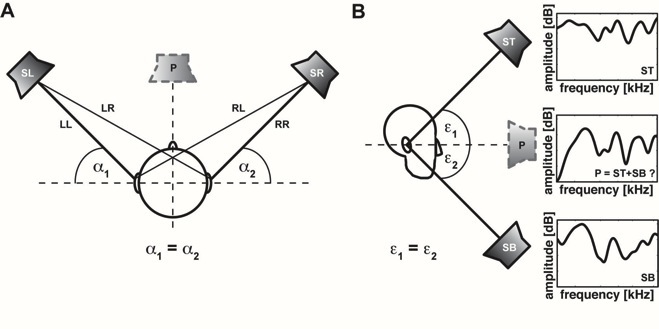
Fig. 1 Schematic of the physical situation in double speaker experiments with symmetric speaker arrangements in azimuth (A) and in elevation (B). A The emergence of a phantom source percept in azimuth can be understood by the underlying physics. In the case that α1 = α2 interaural differences in time of arrival (ITD) and level (ILD) cancel each other. The path lengths LL and RR as well as LR and RL are the same. This results in an ITD of zero. Likewise, attenuation by the head is the same for both speakers resulting in an ILD of zero. Both cues point towards zero azimuth, i.e. straight ahead. B Single sound source localization in elevation is based on monaural spectral cues (HRTFs = head-related transfer functions). Can the phantom source at zero elevation that is heard by the subject be explained by the sum of the HRTFs corresponding to the speaker location ST and SB, i.e. is P = ST + SB? Or are neuronal processes involved in the emergence of the phantom percept?
SL = Left speaker, SR = Right speaker, ST = Top speaker, SB = Bottom speaker, P = Phantom source, α1 = Angle between speaker SL and the ear, α2 = Angle between speaker SR and the ear, ε1 = Angle between the top speaker and the ear, ε2 = Angle between the bottom speaker and the ear, LL = Path of sound from speaker SL to the left ear, LR = Path of sound from speaker SL to the right ear, RR = Path of the sound from speaker SR to the right ear, RL = Path of the sound from speaker SR to the left ear.
We want to test the hypothesis that phantom percepts in elevation can not simply be explained by the summed HRTF (LTI system!). Our approach is twofold. First, we measure the localization behavior of human subjects to double stimuli in elevation. Using head movements as a pointer rather than a psychophysical measure has the advantage that the subject responds in a more natural way potentially minimizing “cortical” influences. And second we record single and summed HRTFs. These can on the one hand be correlated with the subject’s localization response and on the other hand summed HRTFs can be compared to the single HRTFs.
Methods: Orienting responses towards double stimuli in elevation
All experiments were performed in a dark 3 m x 3 m x 3 m room lined with acoustical foam that attenuated sound reflections above 500 Hz. Background noise was determined to be 30 dBA. Sounds were presented from a total of 58 speakers mounted on a vertical circular hoop, 2.5 m in diameter (Fig. 2A). Loudspeakers were mounted in 5 deg increments from -55 to 85 deg on the front and from -57.5 to 82.5 deg on the back (double-polar coordinates). This displacement increased the spatial resolution to 2.5 deg in elevation. The hoop could be positioned at any arbitrarily chosen azimuth by a motor that was mounted to the roof of the chamber. The subject was seated in the center of the hoop (head-centered) on a straight-back chair. The hoop swiveled (360 deg) on an imaginary axis through the subjects mid-sagittal plane. A given stimulus location was achieved by first rotating the hoop around its axis ϑ and subsequently selecting a speaker.
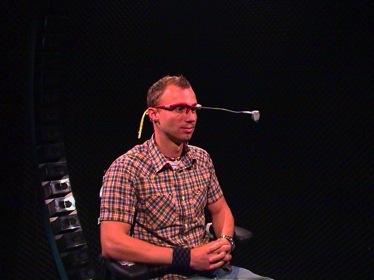
The behavioral testing procedure required the subjects to report the sound location by orienting a head-fixed laser pointer towards the perceived sound location “as quickly and as accurately as possible”. The laser pointer was attached to a modified light-weight sun glasses frame (glasses were removed) and projected its red beam onto a small, frame-attached disk at about 30 cm in front of the subject’s nose (Fig. 2A). This assured that no visual cues (e.g. reflections on the wall and hoop) influenced the localization behavior of the subjects. Additionally, by requiring the subject to fixate the laser dot while orienting towards the target eye-in-head was always 0 deg. Head movements were measured with the magnetic search coil technique.
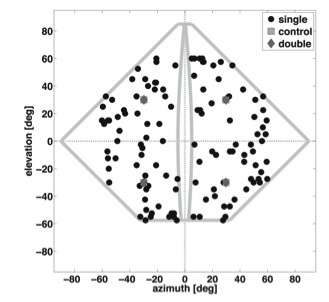
In the experimental session a trial was started by a green fixation LED mounted on the wall at α = 0 deg and ε = 0 deg. The subject aligned his head with this fixation LED and indicated his readiness by pressing a trigger button. This initiated the trial sequence. In a trial one of the following three stimulus types could be presented. 1) The sound was emitted from one single speaker at a location in the frontal hemisphere (single speaker trials; Fig. 2B black circles). 2) The sound was emitted by a single speaker from the same locations that were used for double speaker trials (control trials; Fig. 2B light gray squares). For both single and control trials the level at the position of the subject’s head was 50 dBA. 3) Two speakers emitted the test sounds simultaneously (double trials; Fig. 2B dark gray diamonds). The level of one of the speakers was held constant at 47 dBA while the level of the other speaker could be either one of the following five values: 37, 42, 47, 52 or 57 dBA. Either the top or bottom speaker could be held constant. Additionally, to confound any potential cues due to the noise produced by the hoop or due to the duration of the hoop movements a so-called dummy movement to a random location was performed between two successive trials.
A B
Fig. 2 A Master student Robert Hovingh as a subject in the setup. Subjects wear a glasses frame with a laser pointer mounted on the nose bridge. The laser projects its beam on a small disk mounted in front of it in order to avoid visual cues due to reflections. Head movements are measured with the search coil technique. The small coil is wound around the laser pointer. A part of the circular hoop can be seen on the left. A total of 58 speakers were mounted on the hoop. B Stimulus array. Black circles denote single speaker locations used to determine the subject’s standard localization behavior. Light grey squares denote locations of the single speaker control stimuli. And dark gray diamonds denote the locations of the double speaker stimuli. The light gray lines indicate the boundaries of possible azimuth and elevation locations. Note that the gray lines around α = 0 deg indicate an area that was not used for stimulus presentation. This was done to elicit large head saccades.
Results: Orienting responses towards double stimuli in elevation
The subject’s standard localization behavior in azimuth and elevation was assed by analyzing the single speaker trials. Figure 3 shows representative stimulus-response plots for a Gaussian white noise stimulus of 50 ms duration for one subject. In these plots either response azimuth (Fig. 3a) or elevation (Fig. 3b) saccade endpoints are plotted against the azimuth or elevation target location. Data were fitted assuming a linear relation between response and target locations according to the following equations:
α = Gα * Tα + Bα (Eq. 3)
ε = Gε * Tε + Bε, (Eq. 4)
with α and ε being the response azimuth and elevation components, respectively. Gα and Gε denote the gains, Bα and Bε the biases in degree of the azimuth and elevation response components, respectively. Tα and Tε are the azimuth and elevation components of the target locations. Azimuth gains are slightly larger than one indicating a small overshoot and elevational gains are slightly smaller than one indicating an undershoot. It is apparent that the subject is able to localize the single speaker stimuli accurately.
In Fig. 4 control speaker trials (a) are contrasted with double speaker trials (b) for a subject. In Fig. 4a the ten responses (black lines) made towards the control speakers (light-gray circles) exhibit the overshoot in azimuth and the undershoot in elevation described by the gain and bias shown in figure 3. The distribution of the endpoints has a standard deviation of about 3.17 deg in azimuth and 4.46 deg in elevation (mean over all four locations). And the mean endpoints per location are defined as the subject’s percept for a given location. These percepts are used as a reference for the double speaker responses and are plotted as solid black diamonds in Fig. 4b. In this figure example responses made in double speaker trials with three different intensity conditions are shown. While the constant speaker (light-gray circles) was held at 47 dBA the variable speaker (dark-gray square) was set to 57 dBA (dashed light gray lines), 47 dBA (solid black lines) and 37 dBA (dashed dark-gray lines). It is obvious that the subject’s response is modulated by the intensity relation of the two speakers. If the variable speaker is louder (softer) than the constant speaker the response is directed towards the control percept of the variable (constant) speaker.
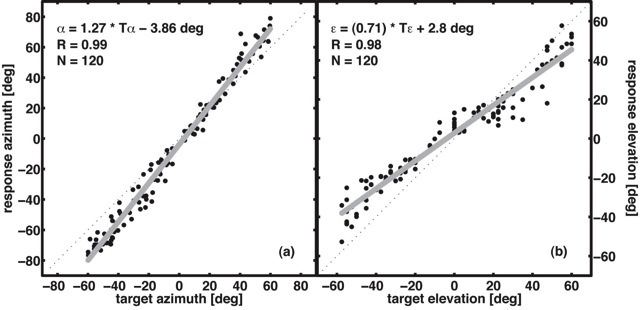
Fig. 3 Representative stimulus response plot for a Gaussian white noise with a duration of 50 ms presented at 50 dBA for azimuth (a) and elevation (b) components of the head saccades.
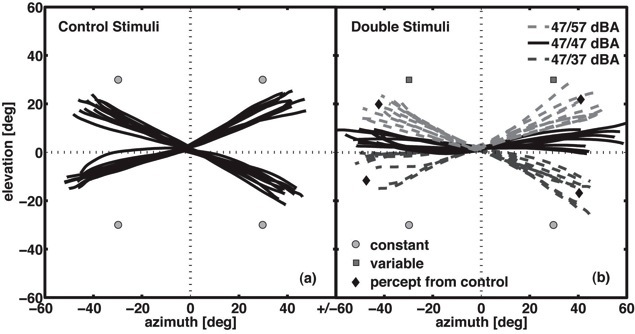
Fig. 4 Head saccades made in control speaker (a) and double stimuli (b) trials. Ten repetitions per condition. (a) Note the overshoot in azimuth and the undershoot in elevation as described in Fig. 3. Stimulus level was 50 dBA. (b) The response is modulated by the relative intensities of the constant and variable speakers. If the variable speaker is louder (dashed light gray lines) than the constant speaker the responses are directed towards the percept of the variable speaker. On the other hand if the variable speaker is softer saccades are directed towards the constant speaker percept (dashed dark gray lines). In the case that intensities of both speakers are identical responses are directed in between the percepts of the two speakers (black lines).
Currently, I am analyzing the HRTFs we have measured. I try to correlate localization behavior in single speaker trials to single HRTFs and of course localization behavior in double speaker trials with summed HRTFs. Additionally, in order to see wether two HRTFs sum up linearly I will try to reconstruct the summed HRTFs by simply adding the corresponding single HRTFs.
I have presented part of the data have at this year’s ARO Mid-Winter meeting in Baltimore (Session X12, February 18, 2009). If you are interested download our poster entitled “Orienting Towards Auditory Double Stimuli in Elevation”.
Recently (16th April 2009) I gave a talk at the Perception, Action & Control meeting within the Donders Institute for Brain, Cognition and Behaviour. The pdf-file of the presentation can be found here.
Outlook